The walked reading wins: First-Principles Data Center Engineering Protocol
Direct Answer Block: When a walked calibrated thermometer disagrees with a CFD simulation, the physical instrument governs—and only physical boundary inputs may be adjusted. In mission-critical data center commissioning and operations, engineers enforce this boundary using deterministic physical equations, calibrated field instrumentation, and auditable sign-off gates rather than relying on vendor brochure summaries, uncalibrated software plots, or verbal assurances. Every measurement and state transition must be recorded with synchronized UTC timestamps and explicit pass/fail thresholds before a signature is granted.
Disagreement is not an error to be smoothed. It is the information. A probe at the inlet and a model at a different place are not two estimates of one truth. They are two sentences. Until you correct the path, the scale, or the place, the walked reading is the one you operate on.
Write both values and both times. Do not take the mean. A mean has no place. It cannot be walked again next week to see if the correction worked.
Correction is not finished when the plot is recolored. The source has to be accepted again if the path changed. A new image, a renamed point, or a moved probe is a new measurement. The old agreement does not transfer.
This rule is the same one a monitor has to live with. A green tile does not outrank a probe because it updates by itself. Automation is not a higher class of evidence. It is a faster class, and speed is how a wrong place gets believed.
1. First-Principles Engineering Formulation and Governing Mathematics
In high-density data center environments, verbal summaries and qualitative status tiles routinely obscure incipient physical failures. Whether auditing a 120 kW liquid-cooled rack boundary, evaluating a 1-second telemetry time series, or verifying plant redundancy prior to handover, the governing physical relationship for this protocol is expressed as:
When any term on the left-hand or right-hand side of this relationship is left unmeasured, inferred from an uncalibrated nameplate, or averaged across an unverified time window, the resulting engineering record cannot support a valid operational signature. Field engineers must verify each physical variable independently using NIST/ISO 17025 traceable instruments before proceeding to the next gate in the sequence.
| Audit Verification Parameter | Unacceptable / Defective Field Practice | Auditable First-Principles Requirement | Mandatory Action on Failure |
|---|---|---|---|
| Primary Boundary Definition | Implied by vendor brochure or slide deck | Explicitly bounded on stamped P&ID / SLD with tag IDs | Halt acceptance; issue formal boundary clarification |
| Measurement & Telemetry Proof | Single uncalibrated display reading or 60-sec average | Calibrated Class A/0.5S sensor with 1-sec UTC timestamp | Reject dataset; classify point as 0x40 Stale or 0x80 Bad |
| Pass / Fail Acceptance Gate | Qualitative "Looks OK" or "Within Normal Range" | Quantitative numerical corridor cited from revision in force | Log Category A/B defect; withhold retainage or permit |
| Custody & Sign-Off Record | Single bundled "Accepted" signature at end of meeting | Scoped, dated sentence naming exact proved & unproved lines | Strike unsupported claims; issue Conditional Refusal |
2. Deep-Dive Technical Protocol and Field Implementation
The following field protocol—adapted directly from Volume 04: Judge a CFD Model for Data Centers—establishes the step-by-step verification mechanics required on the data hall floor:
Model calibration is not the process of manipulating software settings until a simulated temperature contour matches a physical thermocouple reading. Calibration by curve-fitting produces an illusion of accuracy; it does not produce a predictive model of the data hall.
Under governing engineering standards—including ASME V&V 20 (Standard for Verification and Validation in Computational Fluid Dynamics and Heat Transfer) and ASHRAE Guideline 14—calibration is the rigorous identification and correction of physical boundary input errors.
The Permitted Calibration Inputs
If your physical field measurements (from Sheet 1) diverge from the CFD simulation results, you are permitted to alter only those physical parameters that you can touch, walk to, and independently verify in the room.
PERMITTED VS PROHIBITED MODEL CALIBRATIONS
| PERMITTED CALIBRATION PARAMETERS (PHYSICAL INPUTS YOU CAN TOUCH) | PROHIBITED MATHEMATICAL MANIPULATIONS (ARBITRARY MODEL CURVE-FITTING) |
|---|---|
| • Missing blanking panel added | • Artificial turbulent viscosity multiplier adjusted |
| • Blocked floor tile free area % | • Fictitious boundary heat transfer coefficients |
| • Unsealed cable penetration hole | • Arbitrary server airflow multiplier factors |
| • Containment door gap modeled | • Inverting or shifting the temperature color scale bar |
| • Nameplate kW replaced by PDU kW | • Manually overwriting cell temperatures near hotspots |
| • CRAH supply T set to opening avg | • Unnamed 'fudge factors' applied to momentum source terms |
Every parameter modified during calibration must be documented by name, location, and physical justification on Sheet 1:
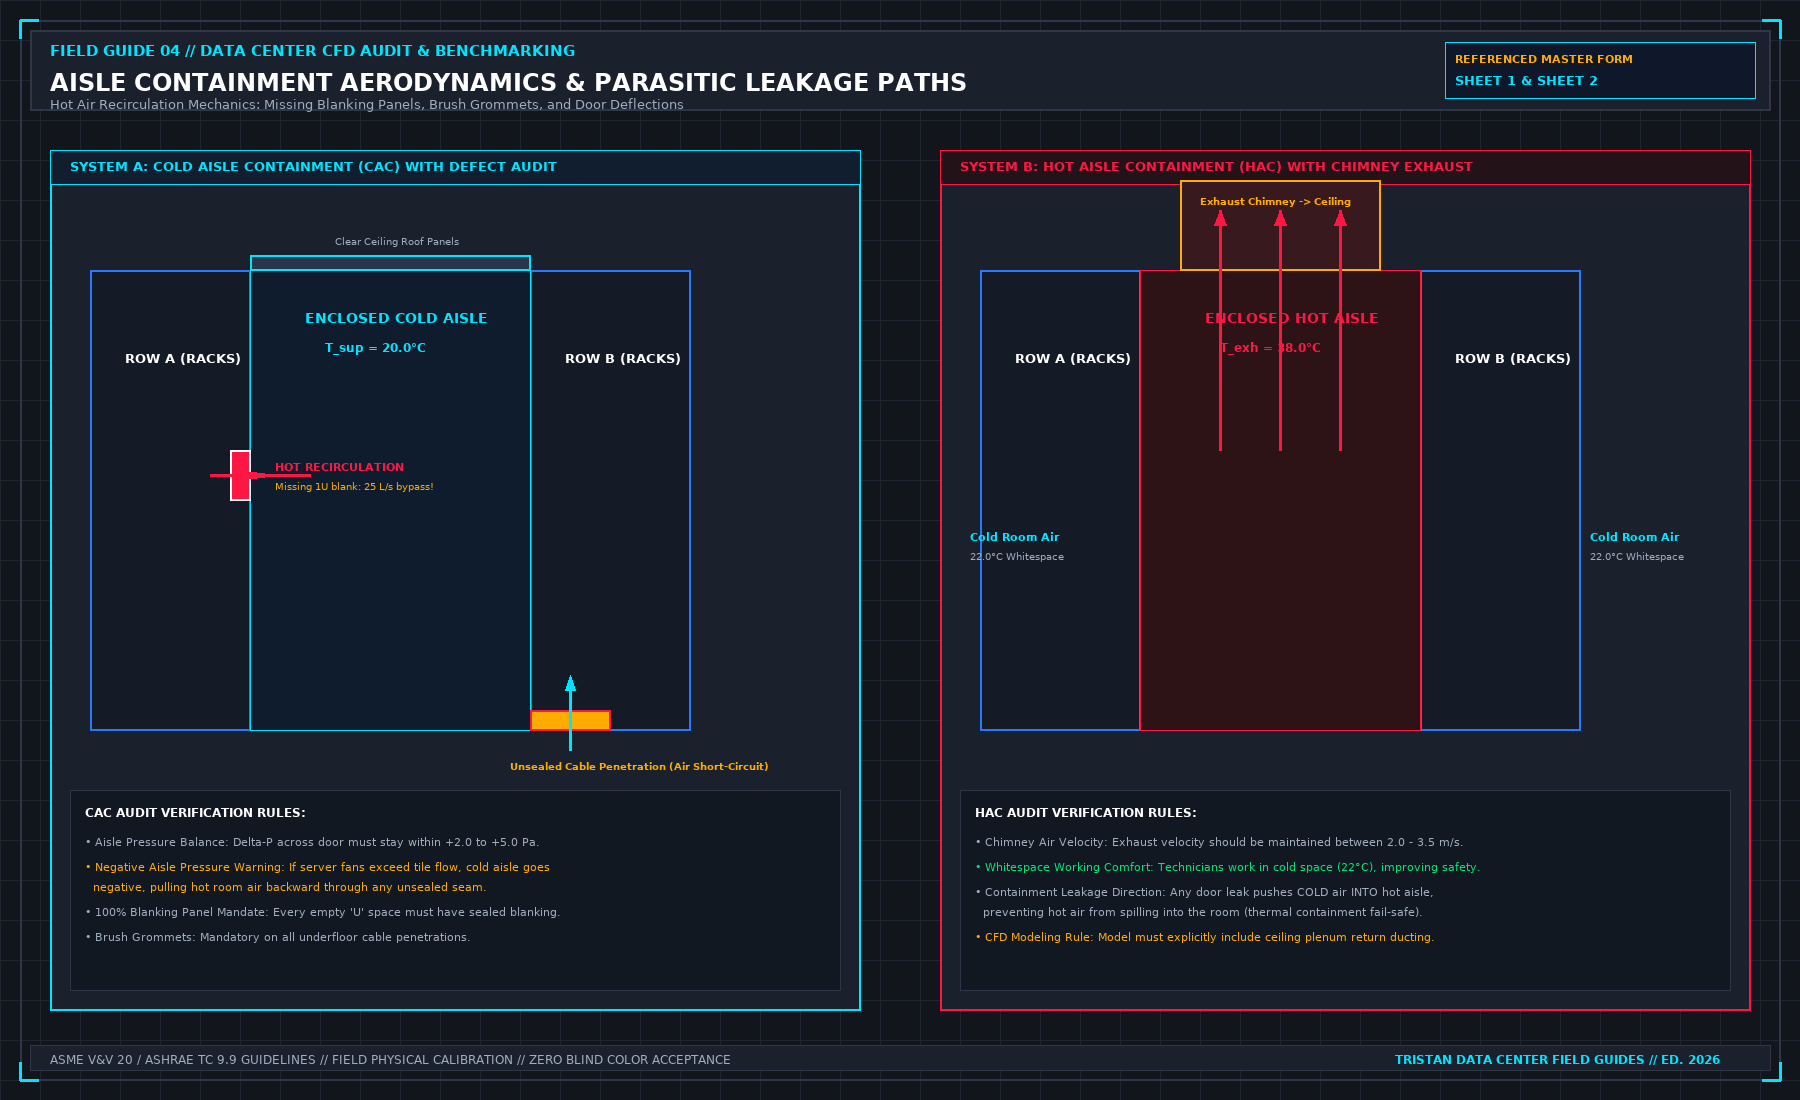
- Missing Blanking Panels: A survey discovers that Rack 12 has two empty 1U slots without blanking panels. The modeler updates the numerical rack face from a solid boundary to an open orifice with 25 L/s of hot exhaust recirculation.
- Floor Grille Obstructions: An underfloor cabling bundle blocks 30% of the free area beneath Tile 04. The modeler updates the tile free open area ratio from 40% to 28%.
- Cable Penetration Leakage: The model assumed sealed raised-floor grommets, but physical inspection reveals three unsealed 200× 200 mm cable cutouts beneath the PDU. The modeler adds these penetrations as open parasitic floor orifices.
- Supply Temperature Sourcing: The simulation assumed a design supply temperature of 18.0°C, but calibrated field probes measure the actual CRAH discharge opening at 20.5°C. The modeler updates the boundary condition to reflect the physical operating setpoint.
- Electrical Power Sourcing: The modeler replaces an initial 15.0 kW nameplate assumption with the physical 8.4 kW reading captured by the PDU branch monitor.
If an adjustment cannot be tied to a documented physical feature within the whitespace, it is strictly prohibited. An anonymous multiplier inserted into a script is an admission of failure disguised as a calibration parameter.
Quantitative Validation Error Metrics
To determine whether a simulation achieves acceptable convergence with physical reality, the model must be audited against quantitative statistical criteria across all benchmarking probes (N ≥ 12 points minimum):
1. Mean Absolute Error (MAE)
Quantifies the average magnitude of absolute error across all sampled measurement locations:
Acceptance Standard: MAE ≤ 1.0 K. An average temperature divergence exceeding 1.0 K across the room indicates a fundamental mismatch in airflow distribution.
2. Root Mean Square Error (RMSE)
Penalizes severe localized outliers more heavily than MAE:
Acceptance Standard: RMSE ≤ 1.5 K.
3. Normalised Mean Bias Error (NMBE)
Determines whether the simulation exhibits a systemic global bias (consistently over-predicting or under-predicting room temperatures):
Acceptance Standard: |NMBE| ≤ 5.0%. A positive bias exceeding 5% indicates artificial thermal trapping; a negative bias exceeding -5% indicates unmodeled parasitic cooling or excessive simulated airflow.
4. Maximum Localized Outlier (Δmax)
Audits the single worst discrepancy across the computational domain:
Acceptance Standard: Δmax ≤ 2.5 K. If any individual server intake probe diverges by more than 2.5 K, that cabinet must be treated as an unresolved localized airflow anomaly.
The Two-Iteration Stopping Rule
Model calibration must not become an open-ended exercise in numerical tuning until the consultant produces an agreeable plot.
Enforce the Two-Iteration Stopping Rule:
- Pass 1: The baseline model is run using as-built drawings and active PDU electrical readings. If errors exceed the acceptance criteria, the physical survey data is cross-checked to identify documented physical anomalies (e.g., missing blanking panels or blocked tiles).
- Pass 2: The identified physical corrections are incorporated into the model geometry, and the solver is re-run.
If after Pass 2 the model still fails to achieve MAE ≤ 1.0 K and RMSE ≤ 1.5 K, stop all further calibration.
The Commissioning Lead must write "MODEL NOT CALIBRATED" in bold ink across the cover of the report. An uncalibrated model may still serve as an abstract conceptual comparison between two design options in pre-construction; it is legally disqualified from certifying the compliance or capacity of the physical data hall.
Quantitative Model Calibration Criteria and Mesh Independence
A calibrated CFD model is not achieved by visually matching a red spot on a color plot to a warm cabinet in the hall. Visual pattern matching is subjective and easily manipulated by shifting the color legend scale by 2^\circC. Engineering calibration requires satisfying quantitative statistical error metrics across all N surveyed physical benchmark locations simultaneously, paired with a documented Grid Convergence Index (GCI) proving that numerical discretization errors do not dominate the solution.
Statistical Calibration Acceptance Thresholds
Let Ti,sim and Ti,meas denote the simulated and physically measured temperatures at benchmark sensor location i ∈ (1, \dots, N), and let Δ Thall = T̄return - T̄supply denote the characteristic hall temperature rise (typically 10.0 K to 14.0 K). A model is contractually calibrated only when all four error metrics fall within the tolerances below:
If the Mean Bias Error (MBET) exceeds ± 0.8 K, the simulation has an unclosed global energy balance—meaning the total electrical heat entered into the model does not match the enthalpy removed by the CRAH boundary conditions (∑ Pair ≠ ∑ ṁCRAH cp Δ TCRAH).
| Calibration Parameter | Permitted Physical Adjustment Source | Prohibited Unphysical "Knob Twisting" | Verification Audit Method |
|---|---|---|---|
| Perforated Tile Loss Coefficient (K) | Adjust to match balometer flow vs measured Δ Pplenum | Assigning arbitrary fixed velocities to individual tiles | Compare simulated tile Δ P-Q curve to manufacturer/balometer data |
| Subfloor Blockage Porosity (γ) | Mapped to physical cable tray & pipe dimensions under rows | Adding invisible baffle walls in empty underfloor zones | Inspect solver geometry wireframe with floor slab hidden |
| Server Chassis Impedance (Rrack) | Derived from OEM fan curve (Δ P vs CFM at measured Tin) | Forcing fixed exhaust temperature instead of heat flux Qair | Verify rack object is modeled as a power source + fan curve |
| Containment Leakage Area (Aleak) | Measured missing blanking U-slots, brush strips, door gaps | Altering global air thermal conductivity kt or gravity g⃗ | Audit solver turbulence model constants (C_μ = 0.09, Prt = 0.85) |
Grid Convergence Index (GCI) and Solver Residual Hygiene
Before accepting any simulation run—whether baseline or calibrated—the audit must verify numerical convergence. First, scaled iterative residuals must drop below 10-4 for continuity, momentum (u, v, w), and turbulence (k, \varepsilon), and below 10-6 for energy, while point monitors placed at the top intake (1.8 m) of the three hottest racks must exhibit flat asymptotic stability (± 0.1 K over the final 200 iterations).
Second, if the computational mesh uses 500 mm coarse hex cells across a 25 mm unblanked server U-slot or a 15 mm underfloor cable cutout, numerical diffusion smears out the high-velocity bypass jet entirely. Require the modeler to demonstrate mesh sensitivity across at least two grid densities (Ncoarse and Nfine with refinement ratio r = (Nfine/Ncoarse)1/3 ≥ 1.3), verifying that the Roache Grid Convergence Index at critical rack inlets satisfies:
Turbulence Closure Sensitivity: Standard k-\varepsilon vs. k-\omega SST in Buoyant Plumes
When auditing a consultant's CFD solver setup on Sheet 1, the engineer must inspect which Reynolds-Averaged Navier-Stokes (RANS) turbulence model was selected to close the Reynolds stress tensor -ρ \overlineu'i u'j. In data hall aerodynamics, flow regimes span forced-convection turbulent jets exiting floor grates (Re > 35,000) and buoyancy-driven natural convection plumes rising from hot aisles (Ri = Gr / Re2 ≈ 0.5--3.0):
| RANS Turbulence Closure | Mathematical Transport Equations | Strengths in Whitespace CFD | Known Pathological Bias in Data Halls |
|---|---|---|---|
| Indoor Zero-Equation / Algebraic | μt = 0.03874 ρ v Lwall | Fast convergence on laptop meshes | Over-diffuses floor jets; underpredicts top-of-rack hotspots by 3--5 K |
| Standard k-\varepsilon (Launder-Spalding) | Turbulent kinetic energy k & dissipation \varepsilon | Robust industrial baseline for high-Re jets | Overpredicts turbulent kinetic energy at impingement stagnation points |
| Realizable k-\varepsilon with Buoyancy | Variable C_μ + full buoyancy generation Gb | Accurately captures round/slot tile jet spreading rates | Preferred baseline for raised-floor & containment audits |
| k-\omega SST (Menter) | Blends near-wall k-\omega with free-stream k-\varepsilon | Resolves adverse pressure gradients & separation | Requires fine boundary mesh (y+ ≤ 5); diverges on poor hex grids |
If a consultant switches turbulence models between the baseline run and the proposed remedy run, the comparison on Sheet 2 is invalid. The exact same turbulence closure and buoyancy terms (Gb) must be locked across all comparative runs.
Auditing Porous-Media Server Chassis Impedance Curves (Δ P vs. Q)
In commercial CFD solvers, a 42U server cabinet is modeled as a lumped porous-media volume with an inertial resistance factor βi and viscous resistance αi:
If the modeler leaves internal server fan curves disabled or sets chassis porosity to 100% open space, the simulated cold-aisle air flows lazily through the rack at uniform velocity rather than being actively drawn by server axial fans (85--120 CFM/kW). Sheet 1 requires verifying that every active cabinet U-space in the model carries an active fan mass-flow boundary coupled to its measured PDU electrical heat dissipation.
Detecting Over-Tuned Local Artificial Resistance Patches
A common deceptive practice when a CFD model fails calibration at a specific cabinet (e.g., Rack R02-08) is inserting an invisible local momentum sink or artificial baffle plate directly in front of R02-08 inside the software domain so that the local temperature rises to match the field thermometer. To catch this, require the consultant to export a complete Object & Resistance Table directly from the solver database listing the (x, y, z) bounding box, porosity γ, and loss coefficient K of every sub-volume in the model. Any object in the solver table that does not correspond to a physical obstruction verified during the floor walk disqualifies the calibration.
3. Field Verification Checklist and Instrumentation Hygiene
To execute this protocol without introducing measurement bias or scope ambiguity, the responsible engineer enforces four mandatory field rules:
- Instrument Traceability Before Observation: Verify that every thermometer (4-wire Pt100 RTD Class A), pressure transducer (≤ ± 0.1% span), flowmeter, balometer, or power analyzer carries a current calibration certificate and passes a pre-test zero/span check on the day of the walk.
- Synchronized Time-Series Capture: Align all digital loggers and gateway pollers to a single UTC reference clock (via IEEE 1588v2 PTP at ± 1 ms for electrical Sequence of Events, or NTP at ± 10 ms for thermal/hydraulic dwells). Never merge unsynchronized CSV files by row index.
- Explicit Isolation of Disturbances vs. Control Handles: Hold upstream supply temperatures, parallel cabinet loads, and containment door states constant during the observation dwell so that transient plant drift is never mistaken for steady-state equipment performance.
- Written Record Prior to Signature: Record every boundary tag, measured value, uncertainty tolerance, and open limitation in ink on the controlled project sheet before leaving the equipment line-up.
Frequently Asked Questions (FAQ)
Why does "The walked reading wins" matter during high-density data center commissioning and operations?
When a walked calibrated thermometer disagrees with a CFD simulation, the physical instrument governs—and only physical boundary inputs may be adjusted. When project teams bypass this rule to meet a commercial schedule milestone, unverified physical assumptions—such as hidden hydraulic pressure drops, unlogged polling gaps, unblanked bypass leakage, or uncalibrated sensor offsets—transfer directly into live 24/7 production as latent single points of failure.
How do you quantitatively verify compliance with "data center CFD calibration boundary conditions" on the physical floor?
Compliance is verified by executing the governing mathematical balance (Q#160;; #160; textair, rack = P#160;; #160; textPDU, meas - #160;; #160; dotm#160;; #160; textCDU cp (T#160;; #160; textout - T#160;; #160; textin)) using independent, calibrated field instruments across a stabilized steady-state dwell window (minimum 15 to 30 minutes for thermal and hydraulic systems), and confirming that the discrepancy between primary and secondary measurements remains strictly within the pre-declared acceptance band.
What should an engineer do if a contractor or vendor submits a report that violates this protocol?
The reviewing engineer must refuse to sign the broad acceptance sentence, mark the specific line item as Unproved / Defective on the official audit sheet, and either require a witnessed re-test under a corrected script or isolate the unproved scope under a time-bounded Conditional Acceptance with a 150% to 200% financial retainage escrow holdback.
From Judge a CFD Model for Data Centers, Tristan, Data Center Field Guides.
Related: A room average is not a cabinet inlet.
Master the Complete Protocol: Judge a CFD Model for Data Centers
Whitespace Aerodynamics, Containment Leakage, Tile Velocity, and Field Validation
Stop relying on contractor spreadsheets and vendor marketing claims. This field guide provides the complete, auditable verification binder—including physical equations, inspection stations, acceptance thresholds, and signed refusal templates.